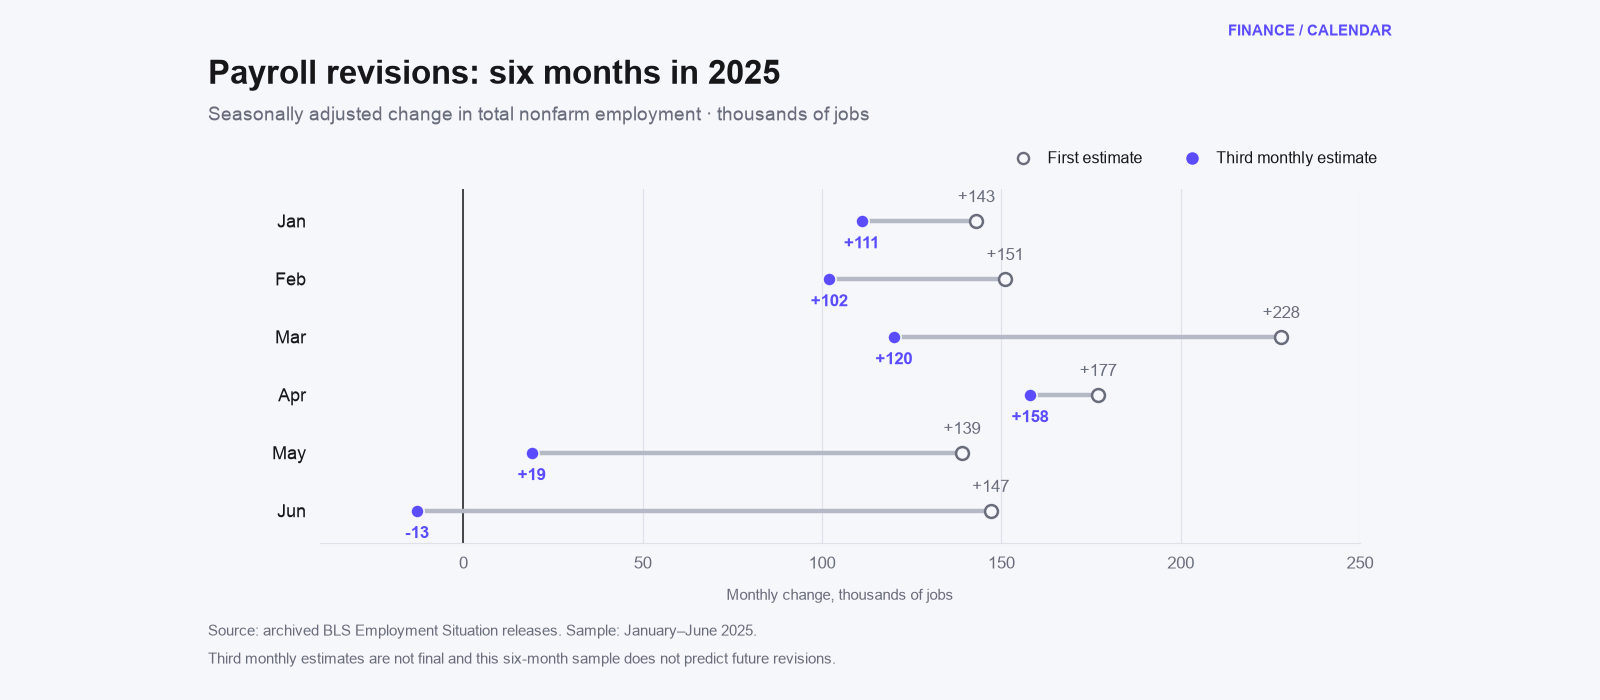
Every US payroll reference month from January to June 2025 had a lower third monthly estimate than its first. Our comparison of eight archived Bureau of Labor Statistics releases puts the median absolute change at 78,500 jobs; June moved from an initial gain of 147,000 to a decline of 13,000. This is a six-month historical case study, not a measure of typical revision behaviour. BLS itself described the May and June revisions announced in August as unusually large.
Contents
The useful question is what a reader could have known at each release. A figure copied from the latest database cannot automatically answer what the original jobs report said. By keeping the first, second and third estimates alongside their publication dates, we can see both the size of a revision and when it became public.
Six reference months, eighteen published estimates
We examine the seasonally adjusted monthly change in total nonfarm payroll employment from the establishment survey, also called Current Employment Statistics. These are payroll jobs, rather than distinct people or the household survey’s unemployment measure. BLS explains the different coverage in its CES questions and answers. Our US jobs report guide covers the recurring release and its calendar.
| 2025 reference month | First estimate | Second estimate | Third monthly estimate | First to third |
|---|---|---|---|---|
| January | +143,000 | +125,000 | +111,000 | −32,000 |
| February | +151,000 | +117,000 | +102,000 | −49,000 |
| March | +228,000 | +185,000 | +120,000 | −108,000 |
| April | +177,000 | +147,000 | +158,000 | −19,000 |
| May | +139,000 | +144,000 | +19,000 | −120,000 |
| June | +147,000 | +14,000 | −13,000 | −160,000 |
January’s sequence ran from 7 February to 4 April; June’s ran from 3 July to 5 September. Across the six months, the first-to-third interval was 56 to 64 calendar days. The reference month stays the same throughout each row. The report arriving in September did not turn June into a September observation.
The table uses the first six consecutive reference months of the calendar year, rather than selecting six individually striking revisions. Even so, a contiguous sample can be unusual. These results describe this particular first half of 2025 and cannot establish how often payroll estimates are revised downward over a longer period.
June changed sign across the regular revision cycle
The 3 July release initially reported that June payrolls increased by 147,000. The 1 August release reduced that estimate to 14,000. The 5 September release then put the change at −13,000. The two revision steps were −133,000 and −27,000, giving a net first-to-third revision of −160,000.
That is a change in the estimate of a past month’s employment movement. It does not mean the act of revising the statistics caused 160,000 people to lose work. Nor does it identify the individual workers or businesses behind the difference. Payroll jobs and people are separate concepts: someone with two covered payroll jobs can appear twice in the establishment measure.
The August report’s widely cited combined downward revision of 258,000 concerned May and June together. It compared their previously published values with the new August values. Our table instead compares each month’s first and third monthly estimates. Keeping those comparison points explicit prevents two different revision calculations from being treated as the same finding.
Two upward steps complicate an all-downward account
All six first-to-third changes were negative, but not every individual revision was downward. April’s second estimate of 147,000 rose to 158,000 in the third publication. May’s initial 139,000 rose to 144,000 in the second publication, before the much larger reduction in August. Both upward steps appear in the 3 July report.
There were twelve regular revision steps across the six months: ten downward and two upward. That distinction matters when describing a sequence. A statement about the net change from the first to third estimate does not describe everything that happened between them. April’s partial recovery, for example, disappears if a chart or spreadsheet retains only the endpoints.
The first-to-third absolute changes were 19,000, 32,000, 49,000, 108,000, 120,000 and 160,000 after sorting. The middle pair is 49,000 and 108,000, so their average gives our sample median of 78,500. It is a description of these six observations, not an allowance to subtract 78,500 from a future first estimate.
The third estimate is still open to later revision
BLS explains that the next two monthly releases incorporate additional employer reports and recalculated seasonal factors. Annual benchmarking is a separate process that uses more comprehensive employment counts derived principally from unemployment-insurance records. Later seasonal adjustments can also change historical figures. The CES FAQ and benchmark technical notes explain these different stages.
Our third-estimate column therefore means the third regular monthly publication for each reference month. It does not mean permanently final, and it does not claim to reproduce the latest values available in November 2026. Substituting today’s benchmarked numbers into that column would change the research question and break its publication chronology.
The September 2025 report also announced an upcoming preliminary benchmark estimate, while explaining that it would not immediately update the official payroll series. We have not inserted that preliminary benchmark into this table. A separate exercise would be needed to trace the effects of its eventual incorporation across historical months.
Reproduce the comparison in a spreadsheet
Record one row per reference month, with separate columns for first, second and third values, their publication dates and their archived source URLs. Calculate the net revision as third estimate − first estimate. If those values occupy B2 and D2, the spreadsheet formula is =D2-B2; an absolute-change column uses =ABS(D2-B2).
For six rows in E2:E7, =MEDIAN(E2:E7) gives the median if E contains the absolute revisions. Retain actual jobs in the cells, rather than mixing jobs and thousands. Preserve a minus sign for June’s third estimate: entering 13,000 instead of −13,000 would understate its net revision by 26,000 jobs.
Adding the first estimates and adding each month’s third estimate would combine figures published on different dates. Such a total is not a single historical employment-level series as it appeared in one release. For that reason, the article leads with the individual observations and median, rather than presenting a mixed-vintage sum as a revised first-half jobs total.
Keep publication dates attached to the figures
The research inputs were checked against the eight linked BLS archives on 1 November 2026. No consensus forecasts, asset-price responses or latest benchmarked replacements enter the calculation. The sample cannot establish systematic bias, political causation or a forecast of future revisions; the exceptionally large May and June changes make generalisation particularly weak.
For a briefing, keep the reference month, release date, estimate number, seasonal-adjustment basis, original value and source together. That record answers what was published at the time, while a current-value column answers a different question. Our Fed information-calendar study applies the same attention to what information is available before a dated decision.
Use this week’s calendar to find the next publications, and the research and guides library for their interpretation. A new report can change the present account of an earlier month as well as add a first estimate for a new one.
About Finance Calendar
Economic release schedules, market calendars and practical guides to using the data.
About the site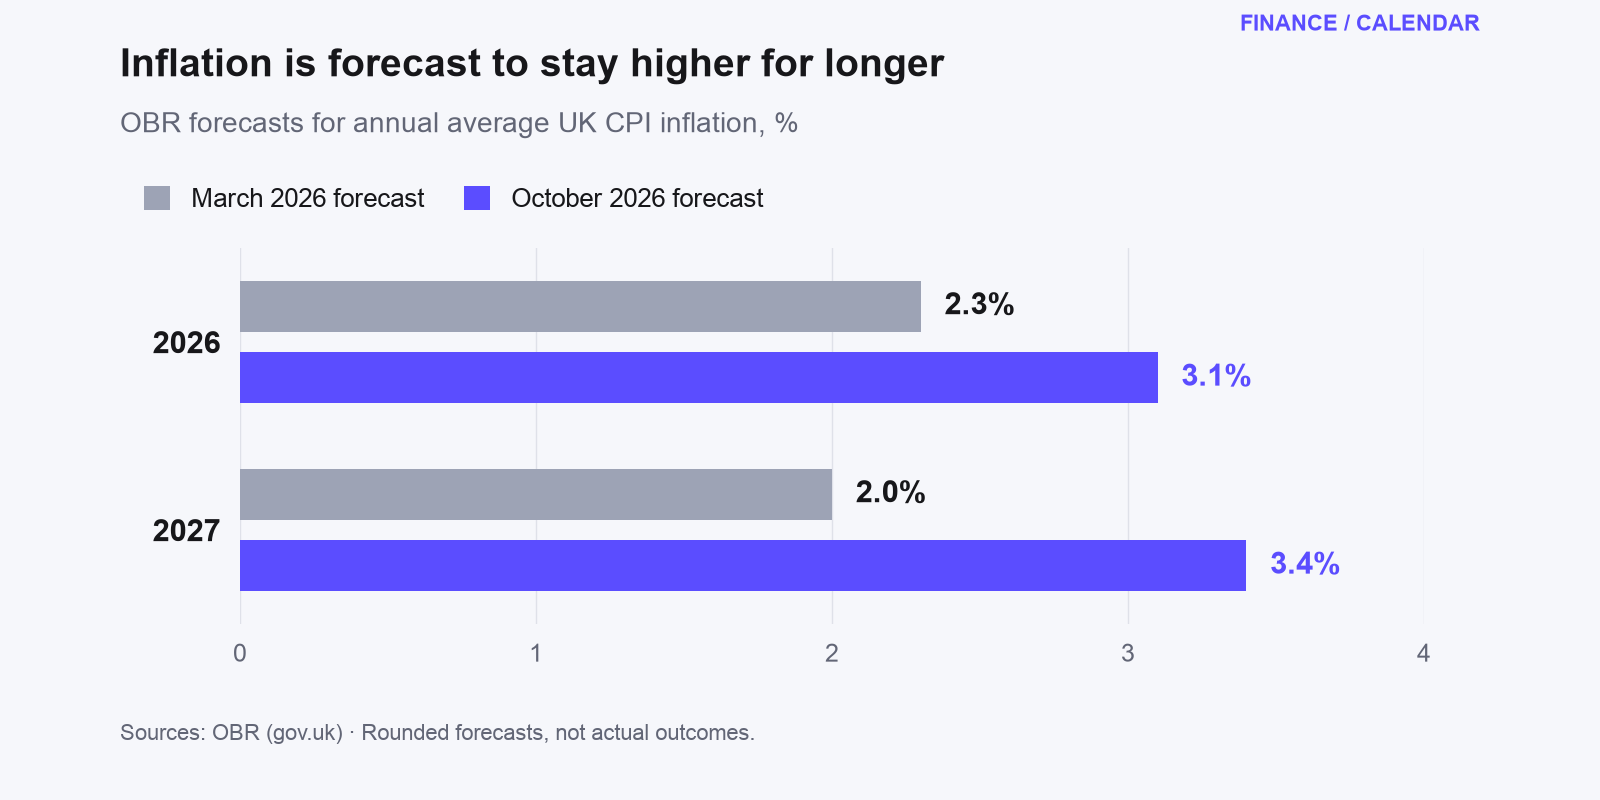
UK Budget 2026: why households may still feel squeezed
A £100 energy payment offers help to eligible households, but higher inflation forecasts explain why lasting relief may take longer. We examine the numbers, eligibility and dates that matter.
US vs UK GDP growth: comparing annualised and quarterly rates
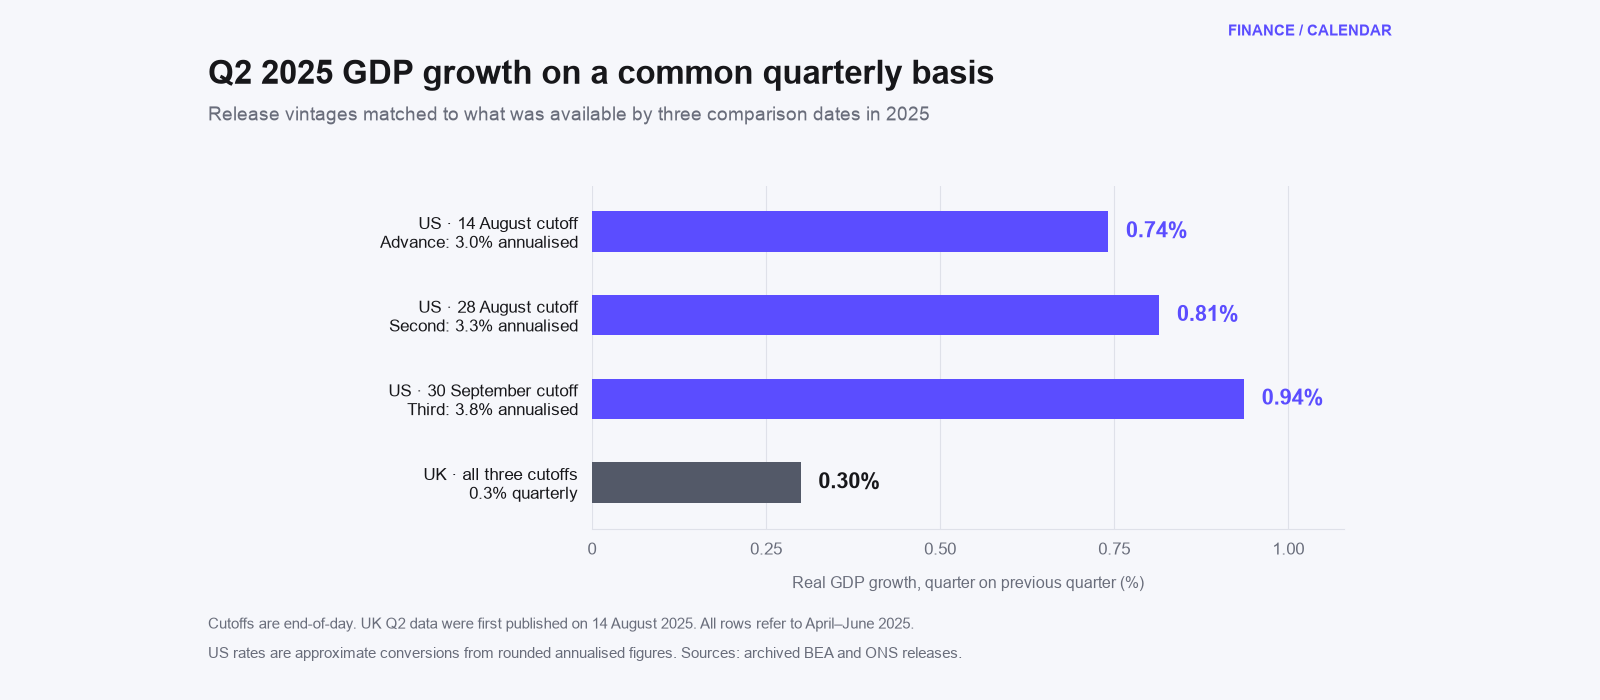
A worked Q2 2025 comparison shows how to convert US and UK GDP growth, match publication vintages and avoid confusing a growth revision with a change in GDP levels.