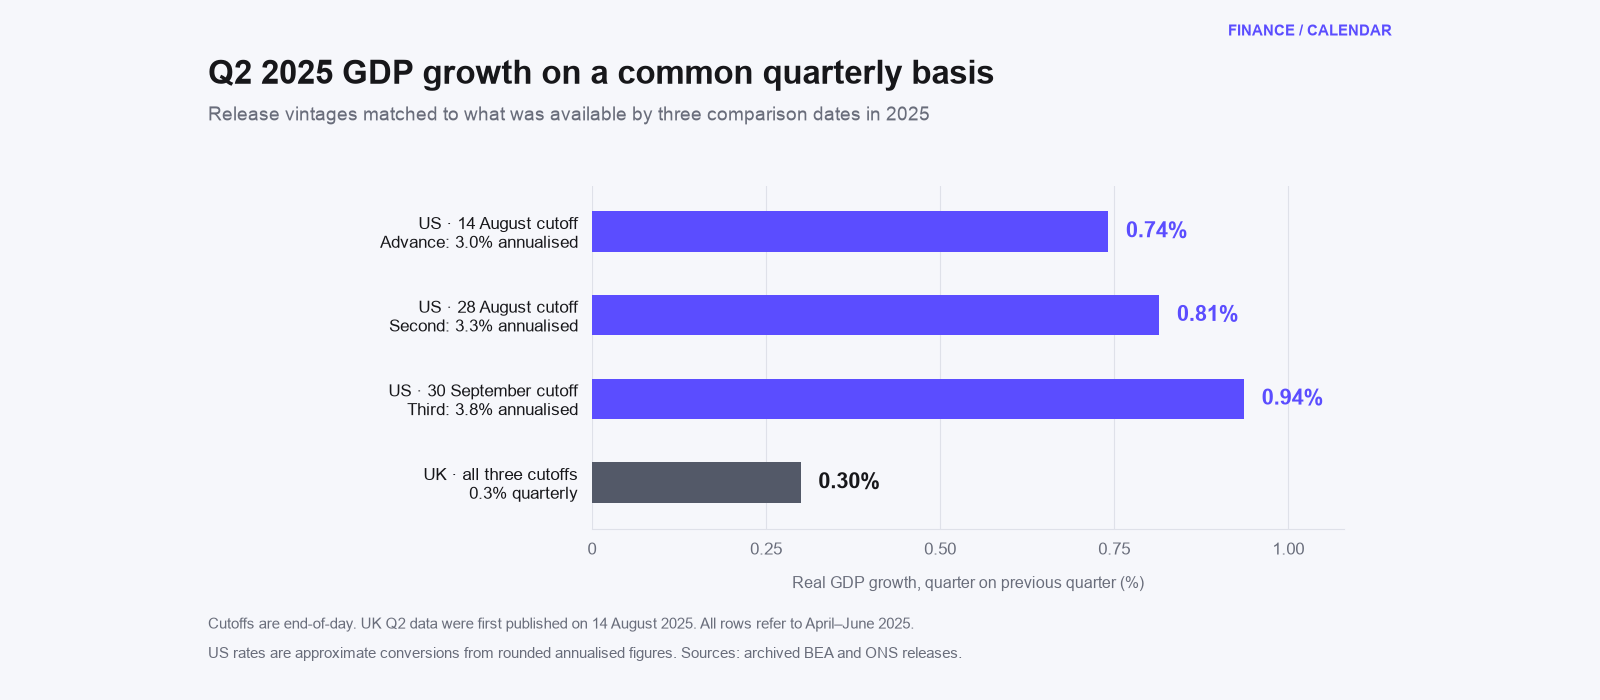
A US GDP headline of 3.8% and a UK headline of 0.3% can describe the same quarter while using different growth conventions. In the September 2025 releases for Q2, the US figure was annualised; the UK figure measured the change over the quarter. Converting the US rate gives approximately 0.94% quarter-on-quarter, putting the matched-basis gap at about 0.64 percentage point. Our reconstruction also shows why the publication date matters: the US figure available in August was different.
Contents
This is a worked historical comparison of five official releases for April–June 2025, rather than a report of today’s GDP estimates. The original contribution is to match both the rate convention and the information available on a given date. That approach is useful when preparing a cross-country chart, checking an old briefing or reading a new release in the economic calendar.
Annualised growth expresses a quarter’s pace over a year
US real GDP releases generally express the quarterly growth rate at an annualised pace. BEA defines this by compounding the quarterly change over four quarters. The number describes how fast output would grow over a year if that quarter’s pace repeated; it is not a forecast that the same pace will continue. The BEA annualisation explanation gives the underlying calculation.
The UK’s quarterly headline directly compares output with the preceding quarter. Both conventions can describe a seasonally adjusted change in real output, but their numerical scales differ. Subtracting the UK 0.3 from the US 3.8 produces 3.5 percentage points by mixing those scales. A useful comparison first converts both rates to a common basis.
On a quarterly basis, the September figures become approximately 0.94% for the US and 0.30% for the UK. On an annualised basis, they become 3.80% and approximately 1.21%. Either comparison uses consistent units. The converted values are Finance Calendar calculations from rounded published rates, not additional official estimates with greater measurement precision.
Five releases updated the account of one quarter
The sequence began with BEA’s advance estimate on 30 July and ended, for this study, with the UK national accounts on 30 September. All five publications concern Q2 2025. A later publication in the table does not mean that another quarter of economic activity has been measured.
| Publication date | Release | Original headline | Common quarterly basis |
|---|---|---|---|
| 30 July 2025 | US advance estimate | 3.0% annualised | Approximately 0.74% |
| 14 August 2025 | UK first quarterly estimate | 0.3% quarterly | 0.30% |
| 28 August 2025 | US second estimate | 3.3% annualised | Approximately 0.81% |
| 25 September 2025 | US third estimate and annual update | 3.8% annualised | Approximately 0.94% |
| 30 September 2025 | UK quarterly national accounts | 0.3% quarterly | 0.30% |
The ONS international comparisons offer a useful independent check. Its August G7 table showed US growth of 0.7% and UK growth of 0.3%, both quarterly. The September table showed 0.9% and 0.3%. Those one-decimal US figures agree with the rounded quarterly conversions above.
The comparison changed as new estimates arrived
On 14 August, the available pairing was the US advance estimate and the UK’s first quarterly estimate. That put the approximate quarterly growth gap at 0.44 percentage point. Once the US second estimate arrived on 28 August, the corresponding gap became approximately 0.51 point. The UK quarterly headline had not changed, but the available US estimate had.
| Comparison date | Available US estimate | Available UK estimate | Quarterly growth gap |
|---|---|---|---|
| 14 August 2025 | Advance: approximately 0.74% | First: 0.30% | Approximately 0.44 percentage point |
| 28 August 2025 | Second: approximately 0.81% | First: 0.30% | Approximately 0.51 percentage point |
| 30 September 2025 | Third: approximately 0.94% | National accounts: 0.30% | Approximately 0.64 percentage point |
Inserting the September US number into an August comparison would introduce information that the August reader did not yet have. A historical chart should therefore identify the publication vintage as well as the reference quarter. The same issue arises when payroll releases revise earlier months: see our jobs report guide for the distinction between publication and reference periods.
September’s US third estimate also incorporated an annual update that changed the preceding-quarter base. Its advance-to-third growth revision of 0.8 percentage point annualised converts to about 0.20 percentage point in quarterly growth. That is a revision to a growth rate, not evidence that the level of Q2 GDP itself rose by exactly 0.20%. BEA describes the base-period changes in its third-estimate release.
Use compounding to convert the rates
Let A be an annualised percentage rate such as 3.8. To recover its quarterly equivalent, calculate ((1 + A/100)^(1/4) − 1) × 100. This gives approximately 0.9368%, which we present as 0.94%. For a quarterly percentage Q such as 0.3, the annualised equivalent is ((1 + Q/100)^4 − 1) × 100, giving approximately 1.2054%, or 1.21%.
In a spreadsheet containing the plain number 3.8 in A2, use =((1+A2/100)^(1/4)-1)*100. For the plain quarterly number 0.3, use =((1+A2/100)^4-1)*100 to annualise it. If A2 is already percentage-formatted and stores 0.038, the quarterly formula instead becomes =(1+A2)^(1/4)-1, with the result also formatted as a percentage.
Simply dividing 3.8 by four gives 0.95%, which is close to the compounded answer but not identical. The difference is mathematical, rather than an additional GDP revision. It also illustrates why extra decimal places should not imply extra certainty: the inputs here were published to one decimal place, so the converted values remain approximations.
An illustrative index makes the units concrete. Start each economy at its own index of 100 at the beginning of the quarter. The September US headline implies an end-quarter index of approximately 100.9368; the UK headline implies 100.3. These separately normalised examples describe changes within each economy. They do not compare the dollar and pound values of their output.
Frequency is only one comparability check
Real GDP removes the effect of price changes; nominal or current-price GDP does not. BEA’s September release reported real growth of 3.8% annualised and current-dollar growth of 6.0% annualised. The September ONS release distinguished real quarterly growth of 0.3%, nominal growth of 1.0% and real GDP-per-head growth of 0.2%. Matching quarterly frequency would not make those different concepts interchangeable.
Check the price basis and seasonal adjustment before converting. Then distinguish quarter-on-quarter, year-on-year and calendar-year growth. A year-on-year figure compares Q2 with Q2 a year earlier, while the quarterly comparison uses Q1. An annualised quarterly pace cannot supply the actual growth outcome for the whole year without the other quarters. BEA’s GDP learning guide explains these conventions.
Keep a source and a vintage beside every comparison
The five primary releases and conversion method were checked on 1 November 2026. This study retains their archived 2025 vintages; it does not reconstruct every subsequent revision or claim these are today’s Q2 2025 estimates. As BEA’s additional GDP information explains, later updates can revise previously published quarters, including a quarter that has already received its third estimate.
A useful comparison record includes the reference quarter, publication date, estimate label, real or nominal basis, seasonal adjustment, original rate convention, converted rate and source. Keep the original value alongside the conversion so another reader can reproduce it. Use this week’s calendar to identify new publications and the research library to interpret them. Growth-rate comparisons describe changes in output; they do not by themselves rank economic size, living standards or future performance.
About Finance Calendar
Economic release schedules, market calendars and practical guides to using the data.
About the site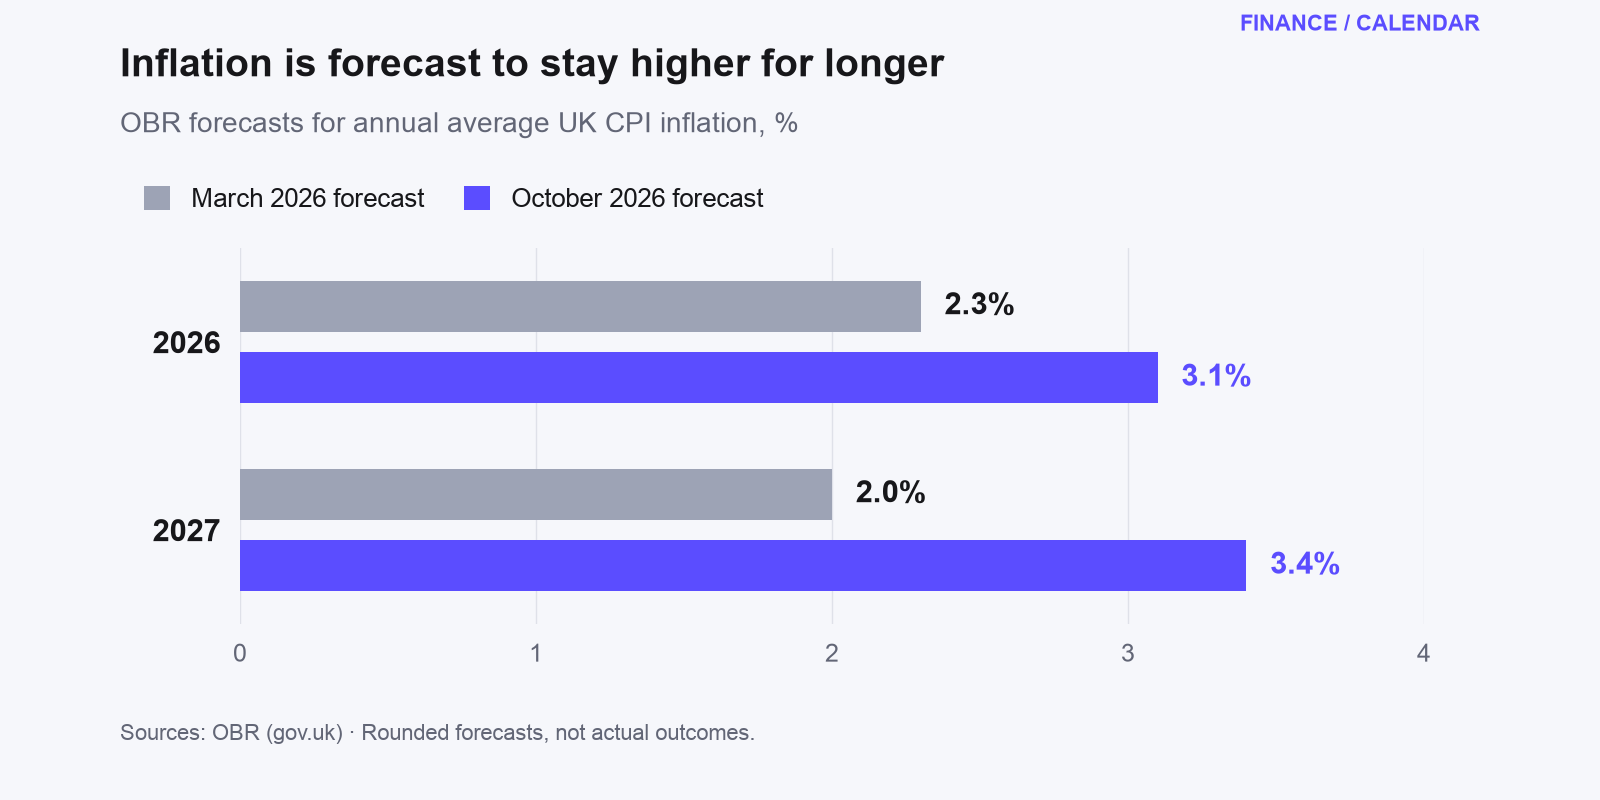
UK Budget 2026: why households may still feel squeezed
A £100 energy payment offers help to eligible households, but higher inflation forecasts explain why lasting relief may take longer. We examine the numbers, eligibility and dates that matter.
US payroll revisions: what changed in the first half of 2025
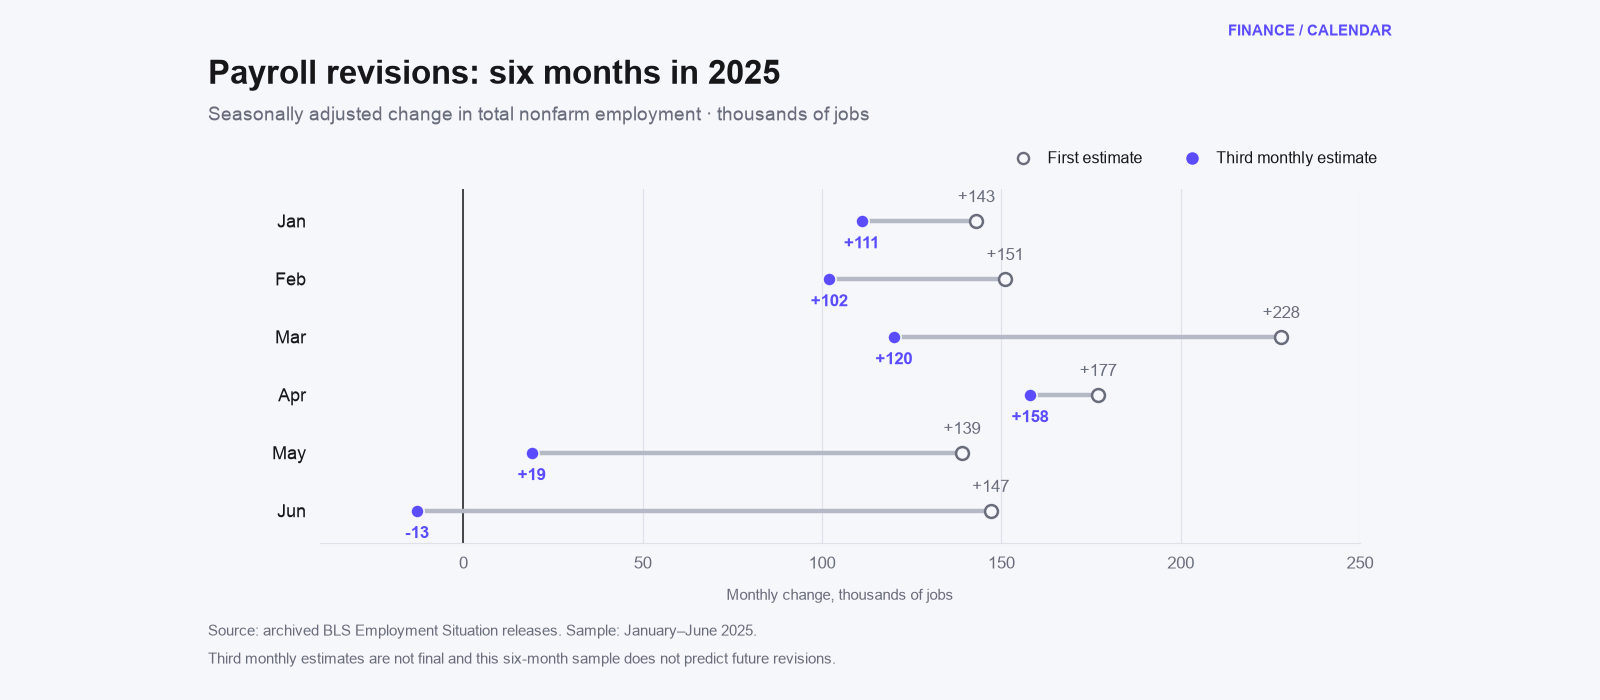
A source-linked study of six months of US payroll estimates: what changed between the first and third releases, how to reproduce it, and why the limits matter.